Wednesday, May 17, 2017

Unit 7: Comparative Advantage 5/10/17

Specialization: Individuals and countries can be made better off if they will produce in what they have a comparative advantage and then trade with others for whatever else they want/need.

Absolute Advantage:The producer that can produce the most output or requires the least amount of inputs (resources)

Comparative Advantage: The producer with the lowest opportunity cost.

Countries should trade if they have a relatively lower opportunity cost.
- They should specialize in the good that is "cheaper" for them to produce.

Input vs. Output:
- Output problem presents the data as products produced given a set of resources (ex: # of pens produced)
- Input problem presents the data as amount of resources needed to produce a fixed amount of output (ex: # of labor hours to produce 1 bushel)
- When identifying absolute advantage, input problems change the scenario from who can produce the most to who can produce a given product with the least amount of resources.


VIDEO:

Unit 7: Mechanics of foreign exchange (FOREX) 5/8/17

- Buying and selling of currency
- Any transaction that occurs in the balance of payments necessitates foreign exchange
- The exchange rate (e) is determined in the foreign currency markets
- The exchange rate is the price of a currency

Changes in Exchange Rates:
- Exchange rates (e) are a function of the supply and demand for currency
- An increase in supply of a currency will decrease the exchange rate of a currency.
- A decrease in supply of a currency will increase the exchange rate of a currency.
- An increase in demand of a currency will increase the exchange rate of a currency.
- A decrease in demand of a currency will decrease the exchange rate of a currency.

Appreciation and Depreciation:
- Appreciation of a currency occurs when the exchange rate of that currency increases
- Depreciation of a currency occurs when the exchange rate of that currency decreases

Exchange Rate Determinants:
- Consumer Tastes
- Relative Income
- Relative Price Level
- Speculation

Exports and Imports:
- The exchange rate is a determinant of both exports and imports
- Appreciation of the dollar causes American goods to be relatively more expensive and foreign goods to be relatively cheaper thus reducing exports and increasing imports
- Depreciation of the dollar causes American goods to be relatively cheaper and foreign goods to be relatively more expensive thus increasing exports and reducing imports


VIDEO:

Unit 7: The Balance of Payments 5/4/17


Balance of Payments: Measure of money inflows and outflows between the U.S. and the rest of the world (ROW)
- Inflows are referred to as CREDITS
- Outflows are referred to as DEBITS

The Balance of Payments is divided into 3 accounts:
1) Current Account
2) Capital Financial Account
3) Official Reserves Account

Current Account:
Balance of Trade (Net Exports)
- Exports (-) Imports
- Exports create a credit to the balance of payments
- Imports create a debit to the balance of payments

Net Foreign Income:
-Income earned by U.S owned foreign assets - Income paid to foreign held U.S assets.

Net Transfers (tend to be unilateral):
Foreign Aid --> a debit to the current account

Capital/Financial Account:
- The balance of capital ownership.
- Includes the purchase of both real and financial assets.
- Direct investment in the U.S is a credit to the capital account.
- Direct investment by U.S firms/individuals in a foreign country are debits to the capital account.
- Purchase of foreign financial assets represents a debit to the capital account.
- Purchase of domestic financial assets by foreigners represents a credit to the capital account.

Official Reserves:
- Foreign currency holdings of U.S federal reserve system
- Balance of payments surplus- Fed accumulates foreign currency and debits the balance of payment
- Balance of payments deficit- Fed depletes its reserves of foreign currency and credits the balance of payment
- Official reserves zero out the balance of payments

VIDEO:


Unit 5: Supply-Side Economics 4/24/17

Supply-Side Economics: They manipulate aggregate supply by enacting policies designed to stimulate incentives to work, save, and invest.
Ex: Tax cuts


Laffer Curve: Theoretical relationship between tax rate and government revenues.
Image result for laffer curve economics
Criticisms of the Laffer Curve:

1) Impossible evidence suggests that the impact of tax rates on incentives to work, save, and invest are small.

2) Tax cuts also increase demand which can fuel inflation.

3) Where the economy is actually located on the curve is difficult to determine.


VIDEO:

Unit 5: The Phillips Curve 4/19/17

Phillips Curve: Inverse relationship between inflation and unemployment. There is no trade-off.
- Each point on the Phillip's curve correspond to a different level of output.


Long Run Phillips Curve:
Image result for long run phillips curve
-Occurs at the natural rate of unemployment
-Represented by a vertical line
-No trade-off between unemployment and inflation, in the long run because the economy produces at the full employment level.
-LR Phillips curve will only shift if the LRAS shifts
-Increase in Un will shift LRPC -->
-Decrease in Un will shift LRPC <--

Natural Rate of Unemployment = Frictional, Seasonal, Structural Unemployment

Image result for short run phillips curve


Short- Run Phillips Curve:

-Since wages are sticky, inflation changes moves the points of the SRPC.
-If inflation persists and the expected rate of inflation rises then the entire SPRC moves upward.

Stagflation: Unemployment and inflation simultaneously rises.


Supply Shocks: Rapid and significant increases in resources costs.
-If inflation expectations drop due to new technology or efficiency, then the SRPC will move downward.

Misery Index: Combination of inflation and unemployment in any given year.
-Single digit misery is good.


Monday, April 10, 2017

Unit 4: Money Creation Formula 3/27/17

  • A Single Bank can create $ by the amount of its excess reserves.
  • The Banking System as a whole can create $ by a multiple of the excess reserves.
  • MM * ER = Expansion of money
  • Money Multiplier = 1/RR

New vs. Existing $:
  • If the initial deposit in a bank comes from the Fed or bank purchase or a bond or other money out of circulation, the deposit immediately increases the money supply.
  • The deposit then leads to further expansion of the money supply through the money creation process.
  • Total change in MS if initial deposit is new $ = deposit + $ created by banking system.
  • If a deposit in a bank is existing $ (already counted in M1), depositing the amount does NOT change the MS immediately because it is already counted.
  • Existing currency deposited into a checking account changes only the composition of the MS from coins/paper $ to checking account deposits.
  • Total change in MS if deposit is existing $ = banking system created money only.

LINK:

Sunday, April 9, 2017

Unit 4: Loanable Funds Market 4/3/17

The Loanable Funds Market is the private sector supply and demand of loans.
-This market brings together the savers and the borrowers.
-This market shows the effect on REAL INTEREST RATE

Demand-Inverse relationship between real interest rate and quantity loans demanded
Supply-Direct relationship between real interest rate and quantity loans supplied
This is NOT the same as the money market (supply is not vertical)

Federal Fund Rate: Interest rate that banks charge one another for overnight loans.

Prime Rate: Interest rate that the banks charge their most credit worthy customers.


Unit 4: Tools of monetary policy 3/30/17

The Fed adjusting the MS by changing any of the following:
1. Setting Reserve Requirements
2. Lending money to banks & thrifts
   -Discount Rate
3. Open Market Operations
   -Buying & Selling bonds

#1 The Reserve Requirement:
-The Fed sets the amount that banks must hold.
-The Reserve Requirement (reserve ratio) is the percent of deposits that banks must hold in reserve (the % they can not loan out)
Using Reserve Requirement:
1. If there is a recession, what should the Fed do to the Reserve Requirement?
   -Decrease the Reserve Ratio
   -RR dec./MS inc./i (interest rate) dec./I (inflation) inc./AD inc.
2. If there is inflation, what should the Fed do to the reserve requirement?
   -Increase the Reserve Ratio
   -RR inc./MS dec./i inc./I dec./AD dec.

#2 Open Market Operations:
-Open market operations is when the Fed buys or sells government bonds (services)
-Most important & widely used monetary policy
-If the Fed buys bonds- it takes bonds out of the economy & replaces them with money. MS inc.
-If the Fed sells bonds- it takes money & gives the security to the investor. MS dec.

#3 The Discount Rate:
-There are money different interest rates, but they tend to all rise & fall together.
-The Discount Rate is the interest rate that the Fed charges commercial banks for short term loans.

Tools of Monetary Policy
Monetary Policy                                 Expansionary Policy                            Contractionary Policy
Open Market Operation                              Buy Bonds                                              Sell Bonds
Reserve Requirement                                        dec.                                                          inc.
Discount Rate                                                    dec.                                                          inc.
Bank Reserves                                                   inc.                                                          dec.
Money Supply                                                   inc.                                                          dec.
Federal Fund Rate                                             dec.                                                          inc. 


LINK:
https://courses.lumenlearning.com/macroeconomics/chapter/tools-of-monetary-policy/

Thursday, April 6, 2017

Unit 4: Stocks and Bonds 3/22/17


Bonds or loans, or IOU's, that represent debt that the government or a corporation must repay to an investor. The bond holder has NO OWNERSHIP of the company.

If a corporation issues and then sells a bond. 
- Its is a liability for the corporation
- An asset for the buyer
If that corporation issues a 10k bond with a 10 year term and a 5% interest.
-Nominal interest rate at the time of issue - 5%
If the Nominal Interest Rate falls 3%, the value of the bond increases.

Stock owners can earn a profit in two ways;
1. Dividends: Portions of a corporation's profits, are paid out to stockholders.
-The higher the corporate profit, the higher the dividend
2. Capital Gain: Earned when a stockholder sells stock for more than he or she paid for it.
A stockholder that sells stock at a lower price than the purchase price suffers a capitol loss.

The Money Market:
-Demand for money has an inverse relationship between nominal interest rates & the quantity of money demanded.

The Demand for Money:
What happens if price level increases?
1. Changes in price level
2. Changes in income
3. Changes in taxation that affects investment


The Money Demand Curve slopes down and to the right, because all else being equal, higher interest rates increase the opportunity cost of holding money, thus leading public to reduce quantity or money it demands.

Fractional Reserve System: Process by which banks hold a small portion of their deposits in reserve and loan out the excess.
-Demand Deposits are demanded through the Fractional Reserve System.

Unit 4: Financial Assets & The Time Value of Money 3/21/17

Purchase of Financial Institutions:
1. Store $
2. Save $
   -Savings acct
   -Checking acct
   -CD
   -Money market acct
3. Loan

Interest: Price paid for the use of borrowed money.
Principal: Amount that you borrow.

Types of Financial Intermediates:
1. Commercial Banks
2. Savings + Loans institution
3. Credit Unions
4. Mutual Fund Companies
5. Finance Companies

The Financial System:
Assets- Anything of monetary value owned by a person or business.
   -Financial Asset: A paper claim that entitles the buyer to future income from the seller.
   -Physical Asset: A claim on a tangible object (Ex: house, car). If you go to your bank and take out a loan.... The Bank has created a financial asset. You have created a liability.
Liability: A requirement to pay money in the future (usually w/interest)

5 Major Financial Assets:
1. Loans
2. Stocks
3. Bonds
4. Loan-backed securities
5. Bank Deposits

Interest Rates & Inflation:
Time value of money: A dollar is worth more today than it is tomorrow. You are losing money every second you are not investing it.

Present Value vs. Future Value:
-Future Value: If you invest (or lend) money to someone, it will compound (grow) according to the following equation:
 FV = PV (I + i)^t
-Present Value: The amount of money I need to invest now, in order to get some amount (FV is known) in the future.
PV =      FV      
          (I + i)^N

The Simple Interest Formula:
V = (I + r)^n * p

The Compound Interest Formula:
V = (I + r/k)^nk * p

V: Future Value of $
P: Present Value of $
r: real interest rate(nominal rate-inflation rate)
n: years
k: # of times interest is compounded per year


Wednesday, April 5, 2017

Unit 4: Money and Monetary Policy 3/20/17

What would happen if we didn't have money?
The Barter System: Goods & services are traded directly. There is no money exchanged.

Money: Anything that is generally accepted in payment for goods & services. Money is not the same as wealth or income
Wealth: Total collection of assets that store value.
Income: A flow of earnings per unit of time.

Money can be used as a:
1. Medium of Exchange
-Buy goods & services
2. Unit of Account
-Measuring the value of goods & services
3. Store of Value

3 Types of Money:
Representative Money (represents something of value):
-IOU's
Commodity Money (something that performs the function of money & has alternative uses):
-Salt
-Gold
-Silver
-Cigarettes
Fiat Money (money because the government says so):
-Paper Money
-Coins

6 Characteristics of Money:
1. Durability
2. Portability
3. Divisibility
4. Limited Supply
5. Uniformity
6. Acceptability

3 Types of Money:
Liquidity: Ease w/ which an asset can be accessed and converted into cash (liquidized)
M1 (High Liquidity): Coins, currency, and checkable deposits. AKA demand deposits. In general, this is the MONEY SUPPLY.
M2 (Medium Liquidity): M1 plus savings deposits (money market accounts), time deposits (CD's = certificates of deposit), and Mutual Funds below $100k.
M3 (Low Liquidity): M2 plus time deposits above $100k.


Wednesday, March 8, 2017

Unit 3:Contractionary and Expansionary Fiscal Policy 3/7/17

Contractionary Fiscal Policy: (The Brake)
Laws that reduce inflation, decrease GDP (close a inflationary gap)
- Decrease government spending
- Tax Increases
- Combinations of the two

Expansionary Fiscal Policy (The Gas)
Laws that reduce unemployment rate & increase GDP (close a recessionary gap)
- Increases government spending
- Decrease taxes on consumers

Automatic or Built- in stabilizes:
Anything that increases the governments budget deficit during a recession and increases its budget surplus during inflation without requiring explicit action by policymakers.

Non- discretionary Fiscal Policy:
Transfer Payments:
a) Welfare Checks                       d) Corporate Dividends
b) Food Stamps                            e) Social Security
c) Unemployment Checks            f) Veteran's Benefits


Unit 3: Fiscal Policy 3/6/17


How does the govt stabilize the economy?
- The government has two different tool boxes it can use;
1. Fiscal Policy- actions by congress to stabilize the economy

Changes in expenditures or tax  revenues of the federal government
2 tools of Fiscal Policy:
 Taxes- govt can increase or decrease taxes
 Spending - govt can increase or decrease spending
Fiscal Policy is enacted to promote our nations economic goals: Full Employment, price stability, economic growth


Deficits, Surplus, and Debt:
Balanced Budget
- Revenues = Expenditures

Budget Deficit
- Revenues < Expenditures

Budget Surplus
- Revenues > Expenditures

Government Debt
(Sum of all deficits - sum of all surpluses)

Government must borrow money when it runs a budget deficit

Government borrows from:
- Individuals
- Corporations
- Financial Institutions
- Foreign entities of foreign governments

Fiscal Policy Two Options:
1. Discretionary Fiscal Policy (action)
- Expansionary Fiscal Policy- think deficit
- Contractionary Fiscal Policy- think surplus
2. Non-Discretionary Fiscal Policy (no action)

Three Types of Taxes:
1. Progressive taxes- takes a larger percent of income from high income groups 
Ex: Current Federal Income Tax System
2. Proportional taxes (flat rate)- takes the same percent of income from all income groups 
Ex: 20% flat income tax on all income groups
3. Regressive taxes- takes a larger percent of income from low income groups


LINK:
http://www.glencoe.com/sec/socialstudies/economics/econprinciples2001/pdfs/C09-03C-820487.pdf

Unit 3: Cosumption and Saving 2/23/17

Disposable Income (DI):
- Income after taxes or net income
- DI = Gross Income - Taxes
With DI, households can either:
- Consume (spend money on goods & services)
- Save (not spend money on goods & services)

Consumption:
Household Spending
The ability to consume is constrained by;
- the amount of disposable income
- the propensity to save
Do households consume if DI = 0?
-Yes, autonomous consumption
- Dissaving
APC = C / DI = % DI that is spent

Saving:
Household NOT spending
The ability to save is constrained by;
- the amount of disposable income
- the propensity to consume
Do households save if DI = 0?
-No
APS = S / DI = % DI that is not spent

APC & APS:
APC + APS = 1
1 - APC = APS
1 - APS = APC
APC > 1 .: Dissaving

MPC & MPS:
Marginal Propensity to Consume
- Change in C/ Change in DI
- % of every extra dollar earned that is spent
Marginal Propensity to Save
- Change in S / Change in DI
- % of every extra dollar earned that is saved
MPC + MPS = 1
1-MPC = MPS
1 - MPS = MPC

Determinants of C & S:
- Wealth
- Expectations
- Taxes
- Household Debt

The Spending Multiplier Effect:
- An initial change in spending causes a larger change in aggregate spending or AD
- Multiplier =       Change in AD
                       Change in spending
- Multiplier =            Change in AD
                       Change in C, I, G, or , X
Why does this happen?
- Expenditures & income flow continuously which sets off a spending increase in the economy.

Calculating the Spending Multiplier:
- Can be calculated from the MPC or MPS
- Multiplier = 1/ 1- MPC or 1 / MPS
- Multipliers are (+) when there is an increase in spending & (-) when there is a decrease.

Calculating the Tax Multiplier:
- When the govt taxes, the multiplier works in reverse
Why?
- B/c now money is leaving the circular flow
Tax Multiplier (note: its negative)
= -MPC/1-MPC or -MPC/MPS
-If there is a tax cut, then the multiplier is +, b/c there's now more money in the circular flow.

Unit 3: Aggregate Supply 2/21/17

  • The level of Real GDP that firms will produce at each price level (PL).

Long Run: 
- Input prices are completely flexible & adjust to changes in the price level.
- In the long run, the level of Real GDP supplied is independent of the price level.

Short Run:
- Period of time where input prices are sticky & do not adjust to changes in the price level.
- The level of GDP supplied is directly related to the price level.

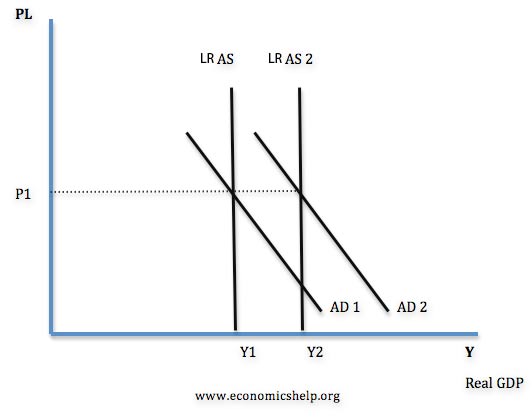
Long-Run Aggregate Supply (LRAS)
The LRAS marks the levels of full employment

Image result for lras graph


Short-Run Aggregate Supply (SRAS)
- Because input prices are sticky in the short run, the SRAS is upward sloping.

Image result for SRAS graph


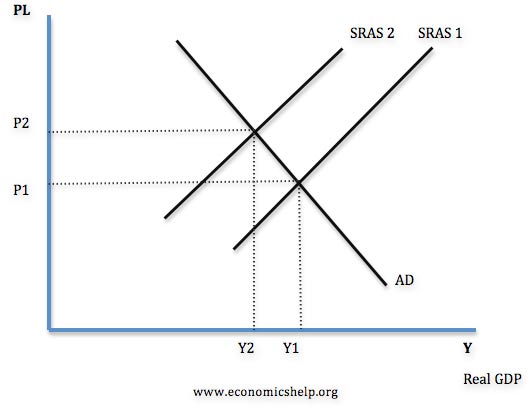
Changes in SRAS:
  • An increase in SRAS is seen as a shift to the right. SRAS ->
  • Decrease in SRAS is seen as a shift to the left. SRAS <-
  • The key to understanding shifts in SRAS is per unit cost of production.
Per unit production cost = Total Input 
                                          Total output


Increase:
Related image

  Decrease:
Image result for decrease in sras


Determinants of SRAS

1. Input Prices:
Domestic Resource Prices
- Wages (75% of all business costs)
- Cost of capital
- Raw materials
Foreign Resource Prices
- Strong $ = lower foreign resource prices
- Weak $ = higher foreign resource prices
Market Power
- Monopolies & cartels that control resources control the price of those resources

Increase in resource prices = SRAS <--
Decrease in resource prices = SRAS -->


2. Productivity
  • Productivity = Total Output / Total Input
  • Most productivity = lower unit production
  • Cost = SRAS -->
  • Lower productivity = higher unit production
  • Cost = SRAS <--

3. Legal- institutional environment
Taxes and subsidies
- Taxes ($ to govt) on business increase per unit
   Production cost = SRAS <--
- Subsidies ($ from govt) to business reduce per unit
  Production cost = SRAS -->
Government Regulation
- Govt regulation creates a cost of compliance = SRAS <--
- Deregulation reduces compliance costs = SRAS -->


Friday, March 3, 2017

Unit 3: Interest Rates and Investment Demand 2/21/17

Investment
Money spent or expenditures on:
-New Plants (Factories)
-Capital Equipment (Machinery)
-Technology (Hardware & Software)
-New Homes
-Inventories (Goods sold by producers)

Expected Rates of Return
How does business make investment decisions?
- Cost/Benefit Analysis
How does business determine the benefits?
- Expected Rate of Return
How does business count the cost?
- Interest Rates
How does business determine the amount of investment they undertake?
- Compare expected rate of return to interest cost
If expected return > interest cost, then invest
If expected return < interest cost, then do not invest

Real v. Nominal
Real % = Nominal % - Inflation%
What determines the cost of an investment decision?
- Real Interest Rate (r%)


Investment Demand Curve (ID)
Shape of the ID curve?
- Downward Sloping
Image result for investment demand curve

Shifts in Investment Demand (ID)
- Cost of Production
- Business Taxes
- Technological Changes
- Stock of Capital
- Expectations

LINK:
https://courses.byui.edu/econ_151/presentations/Lesson_06.htm


Unit 3: Increase in Aggregate Demand 2/17/17

Determinants of AD:
  • Consumption
  • Gross Private Domestic Investment (Ig)
  • Government Spending
  • Net Exports (Xn) = Exports - Imports
1. Change in Consumer Spending
- Consumer Wealth (Boom in stock market)
- Consumer Expectations (PPI fear a recession)
- Household Indebtedness (more consumer debt)
- Taxes (Decrease in income taxes)

2. Change in Investment Spending
- Real Interest Rates (Price of borrowing $)
                                  (If interest rates increase)
                                  (If interest rates decrease)
- Future Business Expectations (High expectation)
- Productivity & Technology (New robots)
- Business Taxes (Higher corporate taxes means...)
3. Changes in Government Spending
- (War...)
- (Nationalized Health Care)
- ( Decrease in defense spending)

4. Change in Net Exports (X - M)
- Exchange Rates
- (If US dollar depreciates relative to the euro National Income compared to abroad)
- (If the US has a recession)

AD = GDP = C + Ig + G + Xn

Government Spending:
- More govt spending (AD >)
- Less govt spending (AD<)


Unit 3: Aggregate Demand Curve 2/16/17

  • AD is the demand by consumers, business, government, and foreign countries.


Image result for aggregate demand curve

Changes in price level cause a move along the curve not a shift of the curve.

Aggregate Demand (AD):
  • The relationship between the price level & the level of the real GDP.


Three reasons why AD is downward sloping:
1. Wealth Effect:
- Higher prices reduce purchasing power of $
- This decreases the quantity of expenditures
- Lower price levels increase purchasing power & increase expenditures

2. Interest Rate Effect:
- As price level increases, lenders need to charge higher interest rates to get a REAL return on their loans
- Higher interest rates discourage consumer spending and business investment

3.Foreign Trade Effect:
- When US price level rises, foreign buyers purchase fewer, US goods & Americans buy more foreign goods.
- Exports fall & imports rise causing real GDP demanded to fall (Xn Decreases)


Shifts in AD
There are two parts to a shift in AD:
- Change in C, Ig, G and/or Xn
- Multiplier effect that produces a greater change than the original change in the 4 components
  • Increases in AD = AD shifts right
  • Decreases in AD = AD shifts left


Monday, February 13, 2017

Unit 2: Unemployment 2/9/17

Unemployment: % of people in the labor force who want a job but are not working.

Labor Force: Consists of unemployed and the employed.

Employed:
  • Work at least 1 hour a month
  • Temporarily absent from work
  • Part time workers
Not in the Labor Force:
  • Kids
  • Full time students
  • People in mental institutions
  • People who are incarcerated
  • Retirees
  • Stay at home parents
  • Military personnel
  • Discouraged

Unemployment Rate Formula:
Number of unemployed      X 100
     Total Labor Force

Standard unemployment = 4-5%


Types of unemployment:
  • Frictional Unemployment: Temporarily unemployed. Qualified w/transferable skills but they aren't working
  • Seasonal Unemployment: This is a specific type of frictional unemployment, which is due to time of year and the nature of the job. These jobs will come back.
  • Structural Unemployment: Changes in the structure of the labor force make some skills obsolete. Workers DON'T have transferable skills & these jobs will never come back. Workers must learn new skills. The permanent loss of these jobs is called "creative destruction".
  • Cyclical Unemployment: Results from economic downturns (recession). As demand for goods & services falls demand for labor falls and workers are fired.  

  • ⅔ of unemployment are unavoidable: Frictional, Structural
  • Together they make the NRU (natural rate of unemployment)
  • We are at full employment if we only have 4–5% unemployment(NRU)
  • Full employment means NO cynical unemployment.
  • Okun’s law: When unemployment rises 1% above natural rate, GDP falls by about 2%


Monday, February 6, 2017

Unit 2: Inflation 2/6/17

Inflation: General rising level of prices
- Reduces Purchasing Power of money

Purchasing Power: The amount of goods & services that money buys
Deflation: A decline in the general price level
Disinflation: Occurs when the inflation rate itself declines

Three Causes of Inflation
:
1) Printing too much money
2) Demand-Pull Inflation:
"Too many dollars chasing two few goods"
  • Demand pulls up prices!
  • Demand increases but supply stays the same. The result is a shortage driving up prices
  • An overheated economy with excessive spending but same amount of goods.
3) Cost-Push Inflation
  • Higher production costs increases prices

Inflation Formula:
Current Year Price Index - Base Year Price Index     X 100
              Base Year Price Index

Hurt by Inflation:
  • Lenders- people who lend money (at fixed interest rates)
  • People with fixed incomes
  • Savers
Helped by Inflation:
  • Borrowers- people who borrower money
  • A business where the price of the product increases faster than the price of resources


Rule of 70:

Used to calculate the number of years it will take for the price level to double at any given rate of inflation.
Formula =              70                   
                Annual Rate of Inflation


Real Interest Rate: Deals with the amount of money that is borrowed. Adjusted for inflation.
 Real= Nominal Interest Rate - Expected Inflation

Nominal Interest Rate: The percentage increases in money that the borrower pays back to the leader not adjusting for inflation.

Ideal Interest Rate: 2 to 3%


Unit 2: Real GDP & Nominal GDP 2/3/17

Nominal GDP: The value of output produced in current year prices.
-Can increase from year to year if either output or prices increase.
Formula: Price X Quantity <= Output


Real GDP: The value of output produced in constant based year prices. Adjusted for inflation.
-Can increase from year to year if only output increases.
Formula: Price X Quantity

  • In the base year the current price will always be equal to the constant price (nominal & real GDP will be the same)
  • In years after the base year, Nominal GDP will exceed Real GDP 
  • In the years before the base year, Real GDP will exceed Nominal GDP

GDP Deflator: A price index used to adjust from Nominal to Real GDP
Formula: Nominal GDP        X 100
                Real GDP
  • In the base year GDP Deflator will always equal 100
  • Years after the base year, GDP Deflator will be greater than 100
  • Years before the base year, GDP Deflator will be less than 100

Consumer Price Index (CPI): Measures inflation by tracking changes in the price of a market basket of goods.
Formula: Price of Market Basket in current year   X 100
                Price of Market Basket in base year


Unit 2: GDP Cont. 1/31/17

Expenditure Approach to GDP:
C + Ig + G + Xn-(Net Exports-Imports)

Income Approach to GDP:

W- wages (compensation of employees/salaries)
+
R- rents (income received by the households & business that supply properly resources)
+
I- interest (money paid by private businesses to the suppliers of  loans used to purchase capital)
+
P- profits (owning your own business)
+
Statistical Adjustments (Dividends, Corp income tax, Net foreign)

Trade: exports - imports
Budget= Government purchases of goods & services + Government Transfer Payments - Government Tax & Fee Collection


National Income:

1) Compensation of Employees + Rental Income + Interest Income + Proprietors Income + Corporate Profits
2) GDP - Indirect Business Taxes - Depreciation - Net Foreign Factor Payment


Disposable Personal Income: National Income - Personal Household Taxes + Government Transfer Payments

Net Domestic Product:
GDP - Depreciation

Net National Product:
GNP - Depreciation

Depreciation (Consumption of Fixed Capital): The loss of value in capital equipment due to normal wear & tear.

Gross Investment:
Net Investment + Depreciation

Tuesday, January 31, 2017

Unit 2: GDP & GNP 1/27/17

GDP
GDP (Gross Domestic Product): Total value of all final goods & services produced w/in a country's borders in a given year.
  • Includes all production or income earned w/in the US by US and foreign producers.
  • Excludes production outside of the US, even by Americans.

GDP Formula= C + Ig + G + Xn
C: Consumption (67%)
Ig: Gross Private Domestic Investment (18%)
  • Factor equipment maintenance
  • New factor equipment
  • Construction of housing
  • Unsold inventory of products built in a year
G: Government purchases (17%)
Xn: Net Exports (Exports-Imports) (-2%)


Included in GDP:
  • C
  • Ig
  • G
  • Xn
Excluded in GDP:
  • Intermediate goods -Avoid double or multiple counting
  • Used or secondhand- Avoid double or multiple counting
  • Stocks & Bonds- No production
  • Unreported business activity (Ex: Tips)
  • Gifts/Transfer Payments(Public/Private)- Ex: Scholarship, social security, unemployment
  • Illegal activities
  • Non-market activities- Ex: Volunteering, Babysitting


GNP

GNP (Gross National Product): Total value of all final goods & services produced by Americans in a given year.
  • Includes production or income earned by Americans anywhere in the world.
  • Excludes production by non-Americans, even in the US.

GNP Formula:
GDP + Net Foreign Factor Payment


Unit 2: Circular Flow 1/26/17

Image result for circular flow model

Circular Flow model: Represents the transactions in an economy by flows around a circle.

Household: A person or group of people that share an income.

Business/Firm: An organization that produces goods & services for sale.


Tuesday, January 24, 2017

Unit 1:Excess Demand & Excess Supply 1/20/17

Excess Demand:
Quantity demanded is greater than quantity supply (QD>QS), shortage.
Related image
Shortage: Consumers cant get the quantities of items they desire.
Price Ceiling: Occurs when the government put a legal limit on how high the price of a product can be.
Ex: Rent Control


Equilibrium:
The point at which the supply curve and the demand curve intersect.
Image result for equilibrium price


Excess Supply:
Quantity supply is greater than quantity demanded (QS>QD), creates a surplus.
Image result for price floor


Surplus: producers have inventories they cannot get rid of.
Price Floor: Lowest legal price a commodity can be sold at. Used by the government to prevent prices from becoming too low.
Ex: minimum wage


Business Cycles:


Image result for business cycles
  1. Expansion
  2. Peak
  3. Contraction/Recession
  4. Trough
  • 1 cycle is from trough to trough
  • Average cycle is 5 to 7 yrs
  • Recessions last about 14 months
  • Peaks & troughs are meaningless because we never know we are in one until it's over.
  • Trough means the end of recession
  • If a recession loses more than 10% of real GDP, then it's a depression.


Monday, January 23, 2017

Unit 1:Elasticity of Demand 1/11/17

Elasticity of Demand: A measure of how consumers react to a change in price.
Total Revenue: Total amount of money a company receives from selling services.
Marginal Revenue: Additional income from selling one more unit of a good.
Fixed Cost: A cost that does not change no matter how much of a good is produced.
Variable Cost: A cost that rises or falls depending upon how much is produced. Ex: Electricity Bill

Elastic Demand:
  • Demand that is very sensitive to a change in price
  • Product is not a necessity
  • There are available substitutes
  • Ex: Soda, steaks, fur coats
  • E > 1
Inelastic Demand:
  • Demand that is not very sensitive to a change in price
  • Product is a necessity
  • There are few or no substitutes
  • Ex: Gas, sugar
  • E < 1
Unitary Elastic:
  • E = 1


Price Elasticity of Demand:

Step 1: Quantity

New Q - Old Q
        Old Q

Step 2: Price

New P - Old P
       New P

Step 3: PED

 % change in quantity
 % change in price


Supply Problem Formulas:
TFC+TVC=TC
AFC+AVC=ATC
TFC/Q=AFC
TVC/Q=AVC
TC/Q=ATC
AFC*Q=TFC
AVC*Q=TVC
TC-TFC=TVC
NEW TC-OLD TC= MC


Unit 1: Production Possibilities Graph 1/4/17

PPG: Shows the alternative ways  to use an economy's resources
Efficiency: Using resources in such a way to maximize the production of goods and services. Increases profits.
Under utilization: Opposite of efficiency. Using fewer resources than an economy is capable of using. Leads to decreased profits.
Law of Increasing Opportunity Cost: When resources are shifted from making one good or service to another, the cost of producing a second item increases.
Image result for outside to inside production possibilities graph
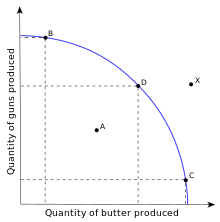
  • Point D (on the curve)- Attainable & efficient
  • Point A (inside the curve)- Attainable, but inefficient. Under utilization, unemployment or underemployment of resources.
  • Point X (outside the curve)- Unattainable using current resources. Technology, Economic Growth.
Four Key Assumptions:
1. Only 2 goods can be produced
2. Full employment of resources
3. Fixed resources (factors of production)
4. Fixed Technology


Three types of movements that occur within the PPG:

Image result for inside the cure production possibilities graph   1. Inside the curve
Image result for along the curve production possibilities graph 2. Along the PPC


Image result for shifts of the  curve production possibilities graph 3. Shifts of the PPC


Two types of Efficiency
Productive Efficiency:
  • Products are being produced in the least costly way
  • This is any point ON the production possibilities curve
Allocative Efficiency:
  • The products being produced are the ones most desired by society
  • This optimal point on the PPC depends on the desires of society


Unit 1:Basic Concepts of Economics 1/3/17


Basic Concepts of Economics

1. Macroeconomics: study of the economy as a whole
    Microeconomics: study of individual or specific units of the economy, supply and demand

2. Positive economics:
  • Claims that attempt to describe the world as is
  • Descriptive in nature and fact-based
Normative economics:
  • Claims that attempt to prescribe how the world should be
  • Opinion-based
3. Needs: Basic requirements for survival
    Wants: Desires

4. Scarcity:
  • Fundamental economic problem that all societies face
  • How to satisfy unlimited wants with limited resources
   Shortage: Quantity demanded exceeds quantity supply 

5. Goods: Tangible commodities
  • Capital Goods: Items used in the creation of other goods
  • Consumer Goods: Intended for final use by the consumer
   Services: Work that is performed for someone. (ex: entertainment)


Factors of Production:
1. Land- Natural resources
2. Labor- Work exceeded
3. Capital
  • Human Capital: when people acquire skills & knowledge through experience and education.
  • Physical Capital: Money, tools, machinery
4. Entrepreneurship- Risk taking, take first three factors for promotion. 


Trade-offs: Alternative that we sacrifice when we make a decision
Opportunity Cost: Next best alternative
Guns or Butter: Refers to the trade-offs that a country faces when choosing whether to produce more or less of military goods or consumer goods.
Thinking about the Margins: deciding whether to add or subtract one additional unit of some resource.