Tuesday, January 31, 2017

Unit 2: GDP & GNP 1/27/17

GDP
GDP (Gross Domestic Product): Total value of all final goods & services produced w/in a country's borders in a given year.
  • Includes all production or income earned w/in the US by US and foreign producers.
  • Excludes production outside of the US, even by Americans.

GDP Formula= C + Ig + G + Xn
C: Consumption (67%)
Ig: Gross Private Domestic Investment (18%)
  • Factor equipment maintenance
  • New factor equipment
  • Construction of housing
  • Unsold inventory of products built in a year
G: Government purchases (17%)
Xn: Net Exports (Exports-Imports) (-2%)


Included in GDP:
  • C
  • Ig
  • G
  • Xn
Excluded in GDP:
  • Intermediate goods -Avoid double or multiple counting
  • Used or secondhand- Avoid double or multiple counting
  • Stocks & Bonds- No production
  • Unreported business activity (Ex: Tips)
  • Gifts/Transfer Payments(Public/Private)- Ex: Scholarship, social security, unemployment
  • Illegal activities
  • Non-market activities- Ex: Volunteering, Babysitting


GNP

GNP (Gross National Product): Total value of all final goods & services produced by Americans in a given year.
  • Includes production or income earned by Americans anywhere in the world.
  • Excludes production by non-Americans, even in the US.

GNP Formula:
GDP + Net Foreign Factor Payment


Unit 2: Circular Flow 1/26/17

Image result for circular flow model

Circular Flow model: Represents the transactions in an economy by flows around a circle.

Household: A person or group of people that share an income.

Business/Firm: An organization that produces goods & services for sale.


Tuesday, January 24, 2017

Unit 1:Excess Demand & Excess Supply 1/20/17

Excess Demand:
Quantity demanded is greater than quantity supply (QD>QS), shortage.
Related image
Shortage: Consumers cant get the quantities of items they desire.
Price Ceiling: Occurs when the government put a legal limit on how high the price of a product can be.
Ex: Rent Control


Equilibrium:
The point at which the supply curve and the demand curve intersect.
Image result for equilibrium price


Excess Supply:
Quantity supply is greater than quantity demanded (QS>QD), creates a surplus.
Image result for price floor


Surplus: producers have inventories they cannot get rid of.
Price Floor: Lowest legal price a commodity can be sold at. Used by the government to prevent prices from becoming too low.
Ex: minimum wage


Business Cycles:


Image result for business cycles
  1. Expansion
  2. Peak
  3. Contraction/Recession
  4. Trough
  • 1 cycle is from trough to trough
  • Average cycle is 5 to 7 yrs
  • Recessions last about 14 months
  • Peaks & troughs are meaningless because we never know we are in one until it's over.
  • Trough means the end of recession
  • If a recession loses more than 10% of real GDP, then it's a depression.


Monday, January 23, 2017

Unit 1:Elasticity of Demand 1/11/17

Elasticity of Demand: A measure of how consumers react to a change in price.
Total Revenue: Total amount of money a company receives from selling services.
Marginal Revenue: Additional income from selling one more unit of a good.
Fixed Cost: A cost that does not change no matter how much of a good is produced.
Variable Cost: A cost that rises or falls depending upon how much is produced. Ex: Electricity Bill

Elastic Demand:
  • Demand that is very sensitive to a change in price
  • Product is not a necessity
  • There are available substitutes
  • Ex: Soda, steaks, fur coats
  • E > 1
Inelastic Demand:
  • Demand that is not very sensitive to a change in price
  • Product is a necessity
  • There are few or no substitutes
  • Ex: Gas, sugar
  • E < 1
Unitary Elastic:
  • E = 1


Price Elasticity of Demand:

Step 1: Quantity

New Q - Old Q
        Old Q

Step 2: Price

New P - Old P
       New P

Step 3: PED

 % change in quantity
 % change in price


Supply Problem Formulas:
TFC+TVC=TC
AFC+AVC=ATC
TFC/Q=AFC
TVC/Q=AVC
TC/Q=ATC
AFC*Q=TFC
AVC*Q=TVC
TC-TFC=TVC
NEW TC-OLD TC= MC


Unit 1: Production Possibilities Graph 1/4/17

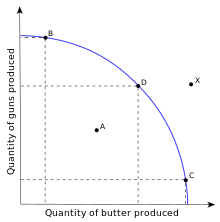
PPG: Shows the alternative ways  to use an economy's resources
Efficiency: Using resources in such a way to maximize the production of goods and services. Increases profits.
Under utilization: Opposite of efficiency. Using fewer resources than an economy is capable of using. Leads to decreased profits.
Law of Increasing Opportunity Cost: When resources are shifted from making one good or service to another, the cost of producing a second item increases.
Image result for outside to inside production possibilities graph
  • Point D (on the curve)- Attainable & efficient
  • Point A (inside the curve)- Attainable, but inefficient. Under utilization, unemployment or underemployment of resources.
  • Point X (outside the curve)- Unattainable using current resources. Technology, Economic Growth.
Four Key Assumptions:
1. Only 2 goods can be produced
2. Full employment of resources
3. Fixed resources (factors of production)
4. Fixed Technology


Three types of movements that occur within the PPG:

Image result for inside the cure production possibilities graph   1. Inside the curve
Image result for along the curve production possibilities graph 2. Along the PPC


Image result for shifts of the  curve production possibilities graph 3. Shifts of the PPC


Two types of Efficiency
Productive Efficiency:
  • Products are being produced in the least costly way
  • This is any point ON the production possibilities curve
Allocative Efficiency:
  • The products being produced are the ones most desired by society
  • This optimal point on the PPC depends on the desires of society


Unit 1:Basic Concepts of Economics 1/3/17


Basic Concepts of Economics

1. Macroeconomics: study of the economy as a whole
    Microeconomics: study of individual or specific units of the economy, supply and demand

2. Positive economics:
  • Claims that attempt to describe the world as is
  • Descriptive in nature and fact-based
Normative economics:
  • Claims that attempt to prescribe how the world should be
  • Opinion-based
3. Needs: Basic requirements for survival
    Wants: Desires

4. Scarcity:
  • Fundamental economic problem that all societies face
  • How to satisfy unlimited wants with limited resources
   Shortage: Quantity demanded exceeds quantity supply 

5. Goods: Tangible commodities
  • Capital Goods: Items used in the creation of other goods
  • Consumer Goods: Intended for final use by the consumer
   Services: Work that is performed for someone. (ex: entertainment)


Factors of Production:
1. Land- Natural resources
2. Labor- Work exceeded
3. Capital
  • Human Capital: when people acquire skills & knowledge through experience and education.
  • Physical Capital: Money, tools, machinery
4. Entrepreneurship- Risk taking, take first three factors for promotion. 


Trade-offs: Alternative that we sacrifice when we make a decision
Opportunity Cost: Next best alternative
Guns or Butter: Refers to the trade-offs that a country faces when choosing whether to produce more or less of military goods or consumer goods.
Thinking about the Margins: deciding whether to add or subtract one additional unit of some resource.